While function MRI (fMRI) can be very effective as a noninvasive method for mapping brain activation, fMRI task mapping does not reveal any information about possible connections between active regions. This connectivity information can provide critical insights into brain function. In certain situations, it can be more important to know how different brain regions communicate with each other during a cognitive activity rather than simply knowing that the regions were active during the task. Effective connectivity is a process used to describe influences among brain regions. We use structural equation modeling (SEM) to determine how regions of the brain influence each other during a specific task, given a constrained set of possible influences (knowledge of these influences comes from known neuroanatomy). An example of a SEM for fMRI of the motor system is shown in the figure below.
![]()
This SEM shows the influences between the supplementary motor area (SMA), the motor cortex (MC) and the cerebellum. The arrows in the model show the direction of the influence. By careful design of fMRI task paradigms, we can explore the validity of different SEM’s for a variety of brain networks.
SEM has been used in a variety of cognitive models of humans and animals using both positron emission tomography (PET) and fMRI. This research has included studies of the memory system, visual attention, motor attention and language production (Büchel C and Friston K.J., 1997; Friston K.J. and Büchel C, 2000; Friston K.J., 1994; Büchel C. et al., 1999; Gonzalez-Lima and McIntosh A.R., 1994; Bullmore E.T. et al., 1996); Friston K.J., 1997) .
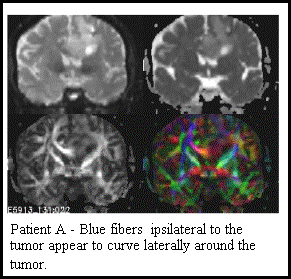
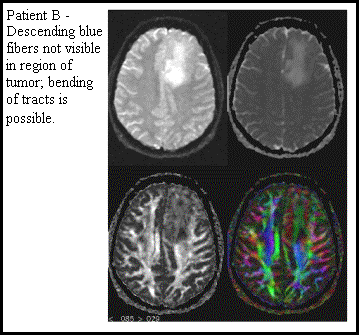
Because our research is largely translational to the clinic, one of our goals is to design SEM’s that are appropriate for a variety of clinical populations. To that end, we are developing a formulation of the SEM approach that incorporates information from diffusion tensor imaging (DTI) to determine the structural connectivity between brain regions. This approach can be particularly valuable in patients whose pathology may be manifested by abnormal connectivity. Therefore, one cannot rely on “known” neuroanatomy from a textbook for example. Obvious examples would include brain tumors that have displaced or interrupted white matter fiber pathways as in the figures shown below with DTI information in color. Other more subtle examples may occur in disorders such as Parkinson’s disease or Schizophrenia (Grafton S.T., 1994)
References
- Büchel C. and Friston K.J. Modulation of connectivity in visual pathways by attention: Cortical interactions evaluated with structural equation modeling and fMRI. Cerebral Cortex, 7: 768-778 (1997).
- Friston K.J. Büchel C. Attention modulation of effective connectivity from V2 to V5/MT in humans. PNAS, 97(13): 7591-7596 (2000).
- Friston K.J. Functional and effective connectivity in neuroimaging: a synthesis. Hum Brain Mapp, 2:56-78 (1994).
- Büchel C., Coull J.T., Friston K.J. The predictive value of changes in effective connectivity for human learning. Science, 283: 1538-1541 (1999).
- Gonzalez-Lima and McIntosh A.R. Neural network interactions related to auditory learning analyzed with structural equation modeling. Hum Brain Mapp, 2:23-44 (1994).
- Bullmore E.T., Rabe-Hesketh S., Morris R.G., Williams S.C.R., Gregory L., Gray J.A., Brammer M.J. Functional magnetic resonance imaging analysis of a large-scale neurocognitive network. Neuroimage, 4: 16-33 (1996).
- Friston K.J., Büchel C., Fink G.R., Morris J., Rolls E., Dolan R.J. Psychophysiological and modulatory interactions in neuroimaging. Neuroimage, 6: 218-229 (1997).
- Grafton S.T., Sutton J., Couldwell W., Lew M., Waters C. Network analysis of motor system connectivity in Parkinson’s disease: modulation of thalamocortical interactions after pallidotomy. Hum Brain Mapp, 2:45-55 (1994).